Why is the Red Line delayed?
Every city loves to pick on their transit agency, but that’s doubly true for the T here in Boston. (Look no further than the wonderful MBTA Excuses page.) These past few weeks have been especially bad for the Red Line, one of the most heavily used transit corridors in the Boston area. Just go ask Reddit.
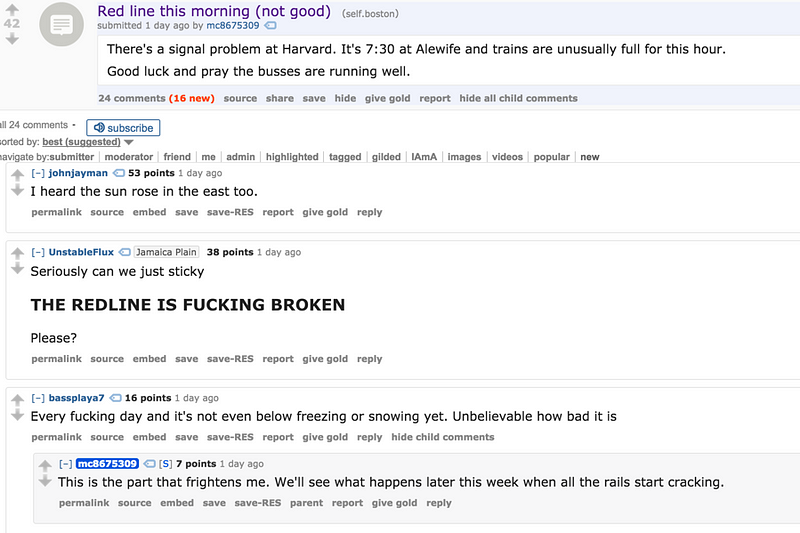
Anyways, with the recent uptick in Red Line issues, I got to wondering: are there any interesting underlying patterns in the failures? While I didn’t have time to do anything fancy with the data, I did manage to assemble some and do a bit of basic poking around.
The Data
The first order of business is obtaining information about delays. I wasn’t able to find a comprehensive database of the MBTA’s Alerts archived anywhere. There is a “MBTA Performance Dashboard”, but they only provide data on an abstract metric of reliability, which isn’t as granular as I was hoping. My solution was to scrape the last month or so from their Twitter feed. I filtered out everything except Red Line related tweets. I then used a combination of automatic and manual tagging to note:
- The action: a DELAY or a RESUME in normal service
- The reason: such as “disabled train” or “police action”
- The station or range of stations affected
I also noted time of day, whether the alert was an update to a previous issue, and whether the alert was what I’m calling a “hangover” (delays due to a previous delay).
This got me 175 entries from October 14th to December 9th (56 days). There were 85 initial delay actions, with 20 hangovers and 90 updates. That’s 1.51 initial delays per day (not counting updates).
So What’s Going On?
I’m not drawing any strong conclusions from this data. Here’s some fun stuff to look at though.
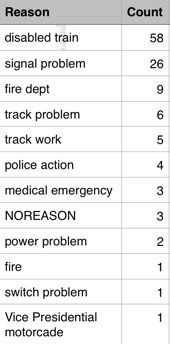
Here’s the initial distribution of reasons. Not surprisingly, disabled trains and signal problems head up the count. Emergency services, power, track problems, and Joe Biden round out the list.
Next question: are there issues that are more common depending on the location? Looks like disabled trains are pretty common throughout, but signal problems are concentrated on the Red Line’s northern few stops.

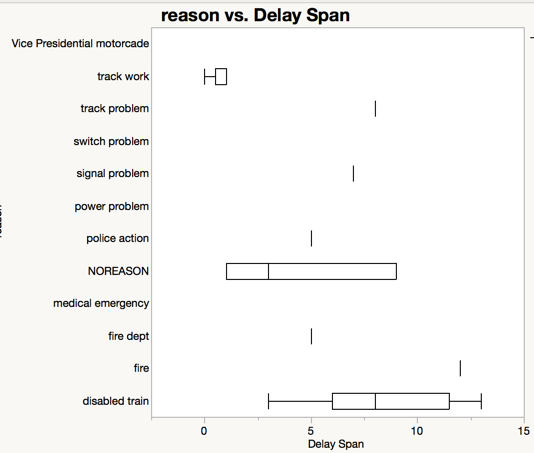
Delays can also occur on stretches of track that span multiple stations. I calculated the number of stops between each station for these instances. Not surprisingly, delays from disabled trains propagate through a wide range a large stretch of stations up and down the line.
Time of Day
Does time of day have anything to do with it? The short answer: probably not. A delayed train can strike at any time! There seem to be more issues in the afternoon and evening rush, but maybe that’s just a consequence of more trains being run.
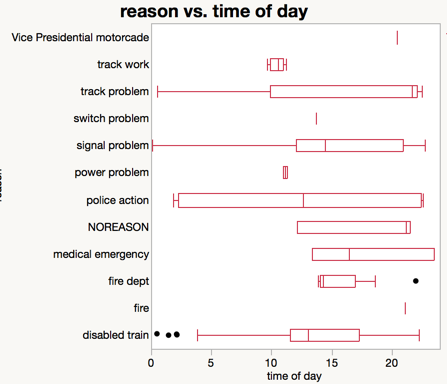
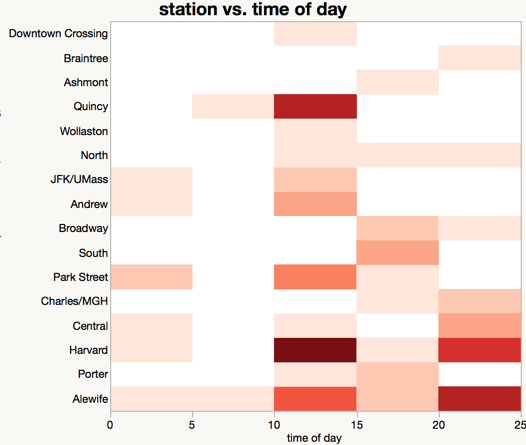
Looking at station by time of day, we can also see that afternoons and evenings are more problematic.
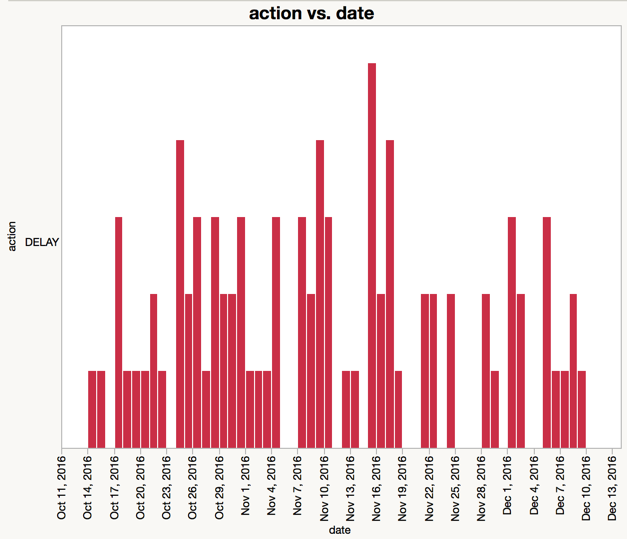
Finally, did things get worse after a certain date? It looks like we had more signal problems lately, but the trains have been pretty uniformly abysmal. Also, there have been only two weeks in the past two weeks where there hasn’t been an issue at Alewife!

Other Miscellaneous Thoughts
- What incidents cause the most delay hangovers? Disabled trains (7), followed by track work (5).
- Which week sucked the most? The one before Halloween with 16 delay actions. Worst single day? 11/15 with 5 separate delay actions.
- There were 52 “minor” delays, 24 “moderate” delays, and 7 “severe” delays.

- Have we had a week with no delays? Of course not! :(
Want to play with the data? I’m seeing if I can get a larger set from the MBTA, but until then: https://gist.github.com/nhfruchter/ba0a4bd17da54c743e3c83f5912b2533
EDIT: Bonus content by Reddit request.
